Consider the following graphs. The first shows the incarceration rate as a function of time (red curve), and the second is a plot of gross federal debt as it has grown over time (black curve). Notice the similarity in the curves. Both indicate when the U.S. was taken off the gold standard by Nixon.


They look very similar. Don't they? Given the striking resemblance of the two, one may have a feeling a correlation exists. Well, what would a curve look like that plotted the incarceration rate as a function of the gross federal debt? See below.
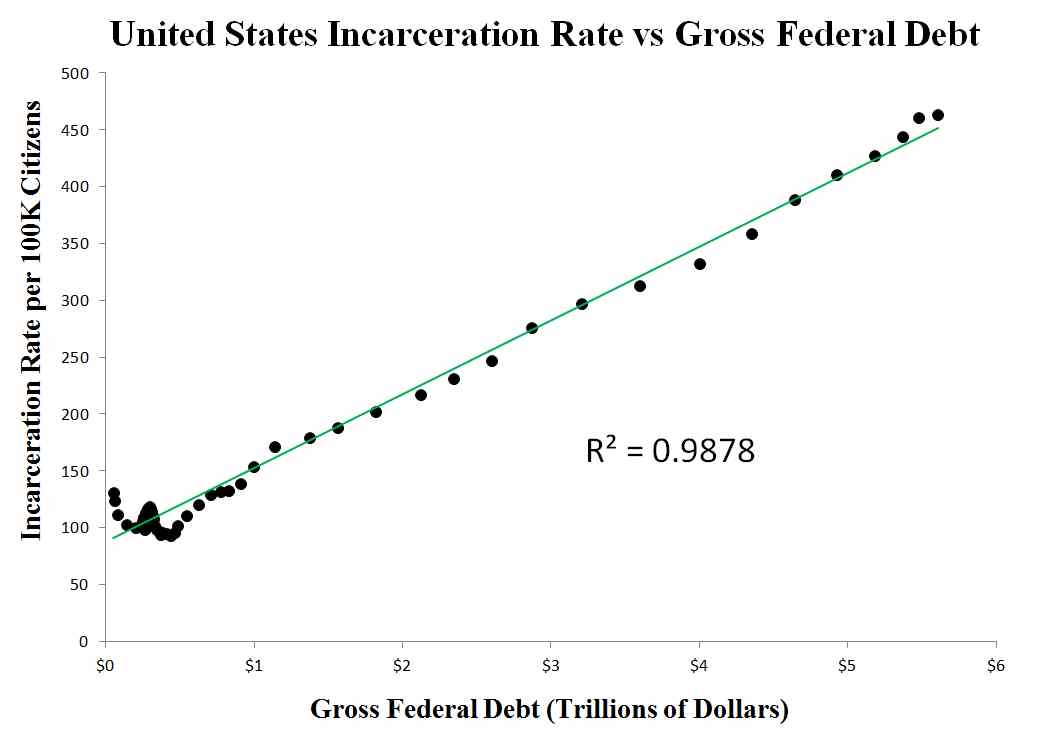
Damn near a straight line! The R2 value is used as a measure to determine the degree of correlation between two sets of data (for those not familiar with statistics). The closer R2 gets to one, the stronger the likelihood a relationship exists between the two sets. ~0.99 is about as close to one as it gets!
This data would lend support to the hypothesis that - "As the federal government gets deeper and deeper in debt, society becomes less and less free" - just as an Austrian would predict.
How about we get that budget balanced?
Follow @DerrelWalters
Wonderful analysis. I conclude from this that human labor is capital. Persons incarcerated are slaves and that their labor is captured for debt repayment.
ReplyDeleteThank you for sharing such detailed analysis. Now, I have an idea on how can I Eliminate Debt.
ReplyDeleteThis comment has been removed by the author.
ReplyDelete